In the Corn Belt, timing drives outcomes. Corn fungicide applications are strongest at tasseling to early silking (VT–R1). Soybeans peak at beginning pod (R3). Sentinel-2 satellite data, summarised through four vegetation indices (NDVI, EVI, NDWI, and NDMI), reads each field’s growth window — without walking every acre.
This piece pairs the agronomic stages with what the satellite is actually seeing, the typical index ranges to expect, and where the management windows fall. Read it once before the season and you’ll spend less time guessing whether to spray.
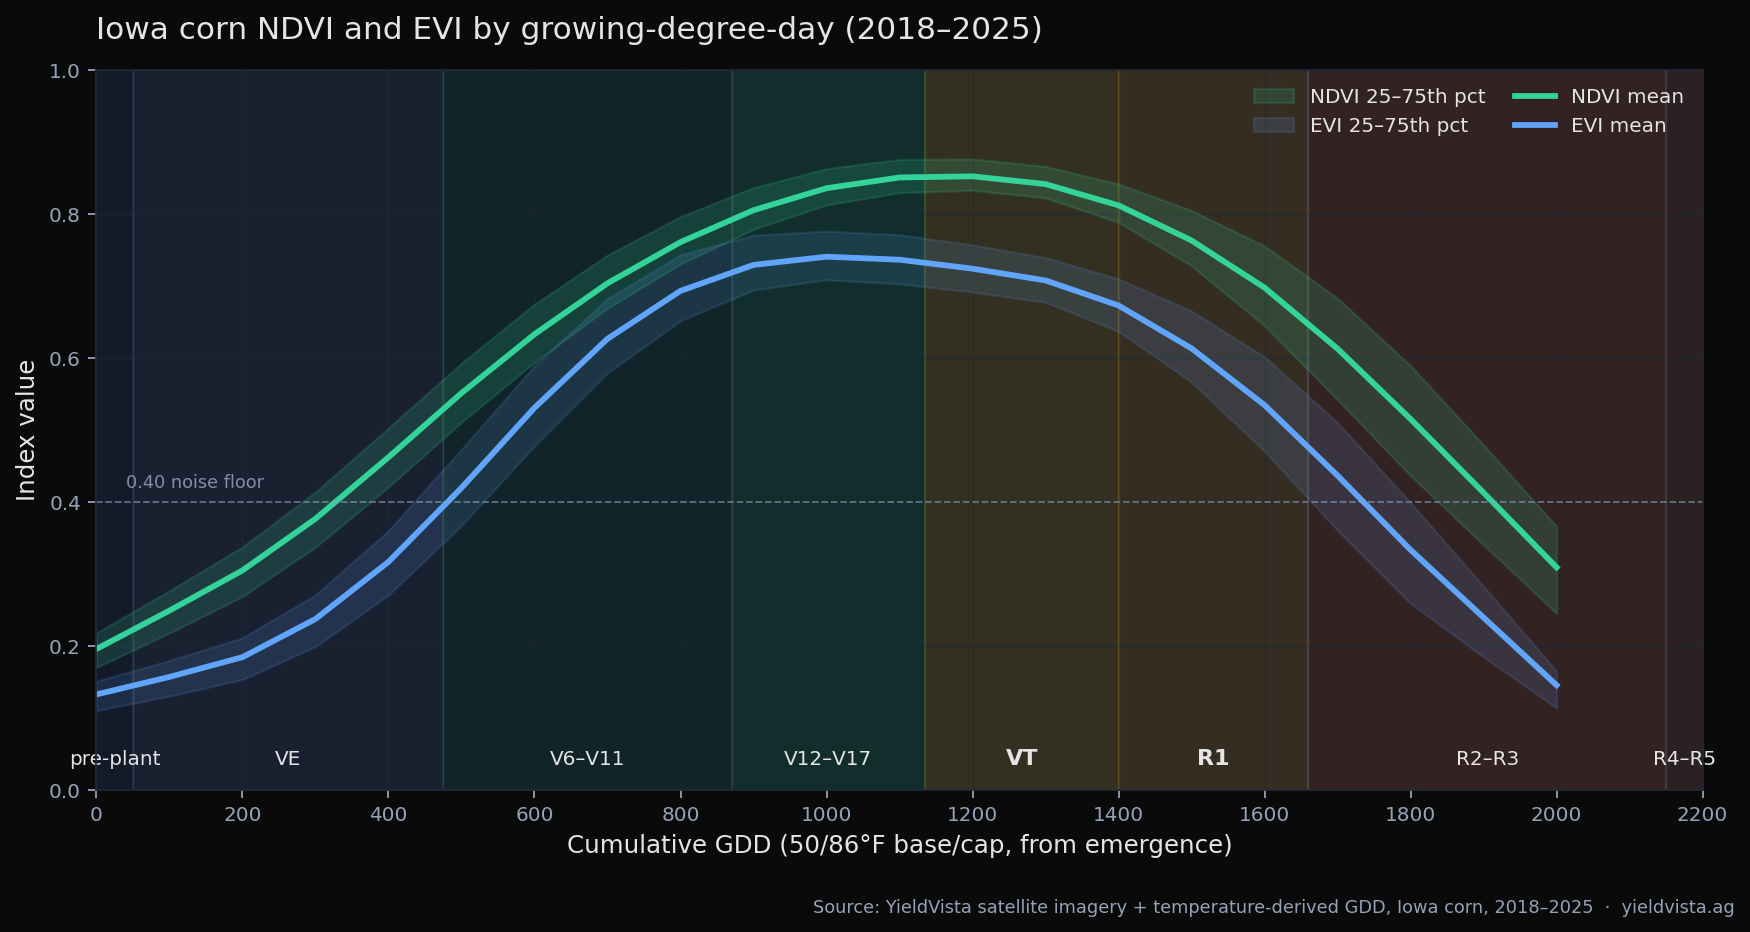
The chart above plots NDVI and EVI against cumulative growing-degree-days (GDD) instead of calendar weeks, so a hot year and a cool year overlay at the same growth stage rather than the same date. NDVI peaks near 0.86 at canopy closure (around V12–VT, ~1100 GDD) and saturates there. EVI follows NDVI but at a lower ceiling (~0.75) and is more responsive to canopy density variation. Both decline through R2–R5 as the canopy senesces. The bands show the spread across counties and years — a typical Iowa field falls inside the band most of the time; outliers are where the field is genuinely off-trend.
Why these four indices, and what each one is good for
The four indices respond differently because they use different parts of the spectrum.
- NDVI uses red and near-infrared. It’s the workhorse — broadly captures greenness and biomass — but it saturates when leaf area index (LAI) passes about 3.0. Above that, NDVI keeps reading 0.85 even as the canopy keeps thickening. So NDVI gives you everything up to canopy closure, then flatlines just when management decisions start to matter.
- EVI adds the blue band as a soil/atmosphere correction. It keeps responding past LAI 3 where NDVI is saturating. In the corn VT–R3 window EVI is usually the better read on whether your canopy is genuinely dense versus just “green enough.”
- NDWI uses near-infrared and shortwave infrared. Leaf water shows up in SWIR before it shows up in greenness. NDWI typically drops several days before NDVI does under drought stress — early warning that matters in pollination and pod-set windows.
- NDMI is similar to NDWI but uses a different SWIR band that responds to canopy and soil moisture together. Good for separating “the plant is thirsty” from “the soil column is dry.”
Practical: when NDVI is high and stable, look at EVI for canopy quality and at NDWI for water stress. They tell you different things about the same field.
Corn growth stages and what the satellite reads
Late vegetative (V12–VT) — the build to peak canopy
- V12. Ear size and kernel-row number are set. NDVI climbs steadily into the 0.65–0.80 band as leaf area expands. NDVI is starting to edge toward saturation, so EVI becomes the more sensitive read. Uniform green-up; deviations here flag nitrogen and phosphorus shortfalls during peak nutrient demand.
- V15–V18. Final leaves emerge. Canopy closure approaches 90–100%. NDVI approaches the seasonal high. Strong NIR reflectance indicates biomass accumulation.
- VT (tasseling). The last branch of the tassel is fully visible. Vegetative growth ends — all leaves are present, plant height is set. NDVI plateaus at 0.75–0.90. EVI stays informative where NDVI is saturating. NDWI and NDMI surface moisture stress at the most vulnerable point of the season.
Reproductive (R1–R6) — the protection window
- R1 (silking). Silks emerge 2–3 days after VT. NDVI at or near the seasonal peak (~0.8–0.9). Stress here, visible as an NDWI dip, hits kernel set hardest of any stage in the season.
- R2 (blister). Kernels form. NDVI begins a slow decline as the plant shifts energy to grain.
- R3 (milk). Rapid fill. NDVI ~0.6–0.75. EVI is the better read on upper-leaf health.
- R4–R5 (dough–dent). NDVI declines faster (0.4–0.6). NDMI is critical for catching late-season moisture stress that doesn’t show up in greenness yet.
- R6 (physiological maturity / black layer). Sharp NDVI drop below 0.4 as senescence sets in.
Fungicide timing — corn
University extension (e.g. Iowa State, Purdue, University of Illinois) generally identifies VT–R1 as the window with the highest expected return on a fungicide application for foliar diseases like gray leaf spot, tar spot, and northern leaf blight. The satellite read complements that agronomic decision: stable or above-baseline NDVI through VT is consistent with healthy ear-leaf canopy; a pre-VT dip in NDVI or EVI is worth discussing with your agronomist as a possible early-disease indicator. Post-R3, extension generally reports diminishing returns because the leaf area has done most of its work. Decisions remain yours and your local agronomist’s — YieldVista is observational, not prescriptive.
Soybean growth stages and what the satellite reads
The reproductive window
- R1–R2 (bloom). NDVI plateaus high. EVI prevents saturation in dense canopies — important in indeterminate beans where canopy keeps building through R2.
- R3 (beginning pod). The fungicide window. Pods are roughly 3/16” at the upper nodes. NDVI near peak. NDWI and NDMI surface pod-set stress.
- R4 (full pod). Stable to slowly declining NDVI.
- R5–R6 (seed fill–full seed). Rapid NDVI drop as the canopy senesces. Little benefit from late applications.
- R7–R8. Dry-down visible as sharp index declines.
Fungicide timing — soy
University extension generally identifies R3 as the window with the highest expected return on a fungicide application for frogeye leaf spot and white mold. The satellite read complements that agronomic decision: NDVI/EVI characterize whether pod-set timing is uniform across the field, and NDWI/NDMI surface the wet-canopy conditions that drive white mold onset. Treatment decisions remain yours and your local agronomist’s — YieldVista is observational, not prescriptive.
A practical lookup table
| Window | NDVI trend | Other indices | What the satellite reads | Management read |
|---|---|---|---|---|
| Corn V12–VT | Rapid rise to peak (0.7–0.9) | High EVI, stable NDMI | Canopy closure + deviation flags | Fungicide prep, N timing, stress identification |
| Corn VT–R1 | Peak (0.8–0.9) | Strong EVI | Maximum vigor, or an early dip | Primary fungicide window |
| Corn R3–R5 | Declining | NDMI drop | Negative deviation + yield impact | Late scouting, rescue applications |
| Soy R3 | Near peak | NDWI read | Pod-stage confirmation | Primary fungicide + insecticide |
| Soy R5–R6 | Rapid decline | EVI senescence | Yield projection | Harvest prep |
Things the satellite does not see
Worth being explicit, because this is where extension content usually hand-waves:
- Stages are not strictly sequential by calendar. Cool weather stretches V12–VT; heat compresses it. Pair the index read with growing-degree-day accumulation for the field, not the planting date.
- The satellite measures top-of-canopy reflectance. Root-zone stress and lower-canopy disease pressure show up in the indices late, after they’ve already started costing yield.
- Cloud cover gaps the read. Sentinel-2 has a 5-day revisit (combining S2A + S2B) at corn-belt latitudes. A wet, cloudy week can leave a field without a clean observation. Most platforms — including ours — fill those gaps with a model that interpolates from surrounding observations + weather. That’s why the same field can show a sharper “dip” on one platform and a smoother curve on another. Ask your provider how they handle cloud gaps before you trust an outlier read.
- NDVI saturation matters more than people admit. In a year with strong canopy build, NDVI peaks early and then stays flat for 4–6 weeks. If you only read NDVI you won’t see a real stress event until it’s already cost you. Pair EVI and NDWI alongside it through R1–R3.
- Index changes need a baseline to be meaningful. A flat NDVI in a year trending up is bad news. The same NDVI in a strong year is fine. Compare to your field’s 5-year baseline, not to an absolute number.
How to use the satellite read in season
- Walk the fields where the satellite is showing an anomaly — not the whole farm. The point is concentrating scout time where the data says something is off.
- Pair the index read with the field’s GDD accumulation, the local forecast, and the field’s history. The satellite is one input.
- When applying fungicide, prefer products with 10–14+ day residual once indices confirm stage and the near-term forecast is dry.
- If your near-term outlook is wet during R1 (corn) or R3 (soy), expect white mold and gray leaf spot pressure to rise faster than the indices will catch — make the call on agronomic risk, not the index alone.
A note on what this is and isn’t
These index ranges are typical Corn Belt observations from Sentinel-2 over recent seasons. Your field can sit outside the bands for any number of agronomic reasons — hybrid genetics, soil type, planting date, stress history, irrigation. Treat the satellite read as one piece of evidence, not the whole picture. Observational intelligence — agronomic decisions still belong with you and your local agronomist.
See your own fields
YieldVista refreshes Sentinel-2 imagery and indices weekly, with the mid-season yield model emitting at six anchor weeks (W22, W26, W30, W34, W38, W42). Sign up to add your fields and see the same view on your own ground.