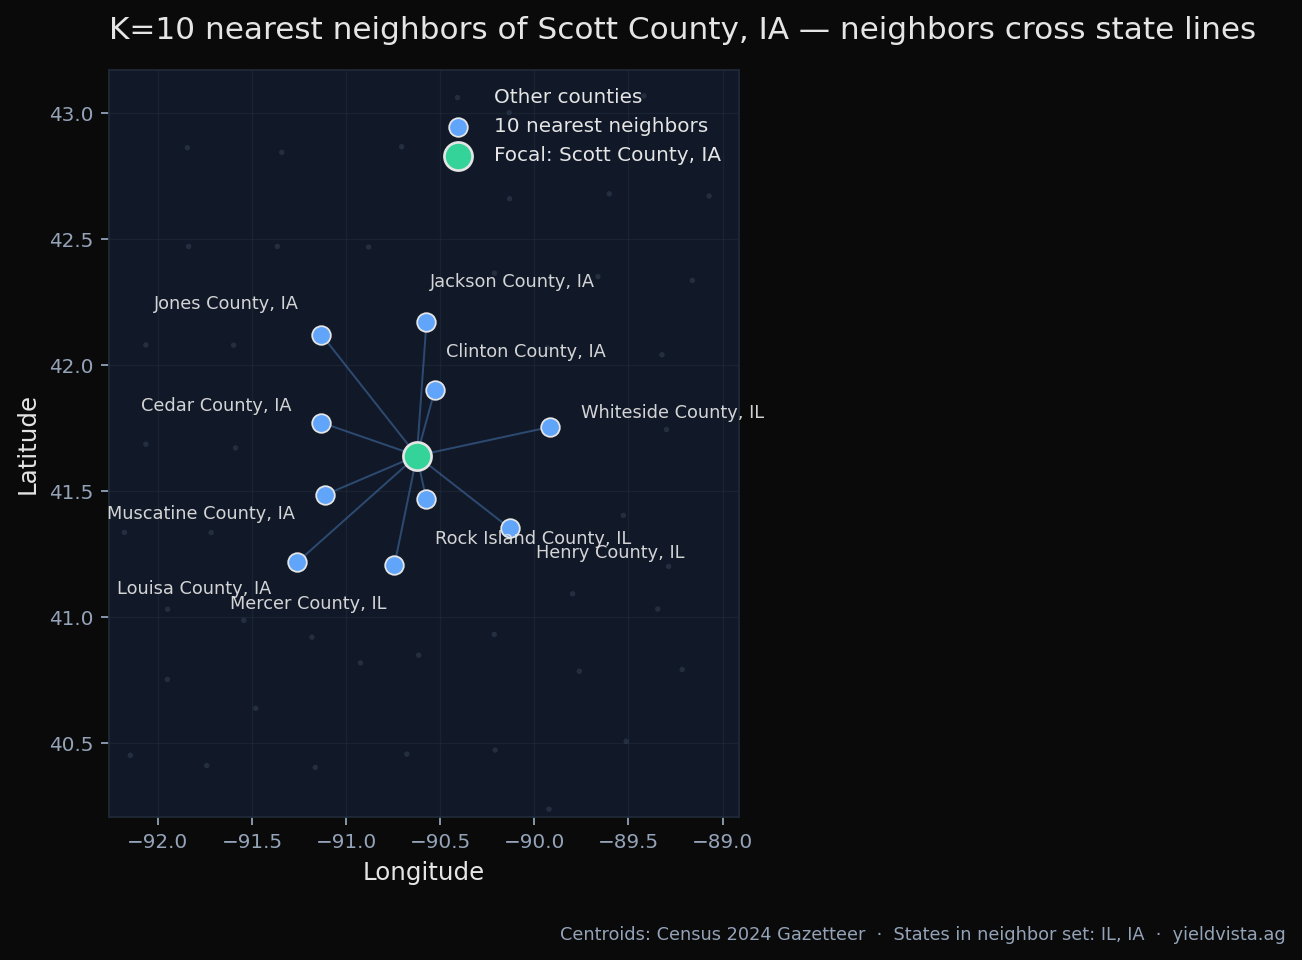
Yield benchmarks are only useful if they're comparable. A field on the IA/IL border has more in common with the next county over in Illinois than with western Iowa. YieldVista solves this by comparing each field or county to its K nearest neighbors — the K closest counties by centroid distance, regardless of state line.
Why "neighbors" is more useful than "state mean"
State averages average across a wide range of climate, soil, and management conditions. A field on the IA/IL border has more in common with the next county over in Illinois than with western Iowa.
How we choose neighbors
For each county, we compute the great-circle distance from its centroid to every other county centroid and keep the K closest. Default K is 10. Centroids come from the Census 2024 Gazetteer file.
What the comparison shows you
When your field's predicted yield is +10% vs the neighbor mean, you're outperforming the surrounding region — usually a sign of timely planting, better drainage, or favourable rainfall. When you're −15%, something field-specific is happening that the broader weather can't explain.
Limits of the metric
K-NN tells you about relative performance, not absolute. Three neighbouring counties hit by the same drought will look "in line" with each other while all three are well below trend. Pair the neighbor comparison with the vs 5-yr trend metric on the same card.