A plain-English guide to interpreting mid-season corn and soy yield outlooks: what R² and RMSE actually mean, why directional intelligence is not the same as a point forecast, and the two validation lenses we report.
What R² tells you
R² (coefficient of determination) tells you how much of the county-by-county variation in observed yield the model explains. R² = 1.0 would be perfect; R² = 0 means the model does no better than guessing the mean. Anything above ~0.7 at mid-season is considered strong in the published literature.
For perspective, a baseline that just predicted the 5-year county average lands near R² = 0.55 in most years. The model has to clear that bar by a comfortable margin to be worth running at all.
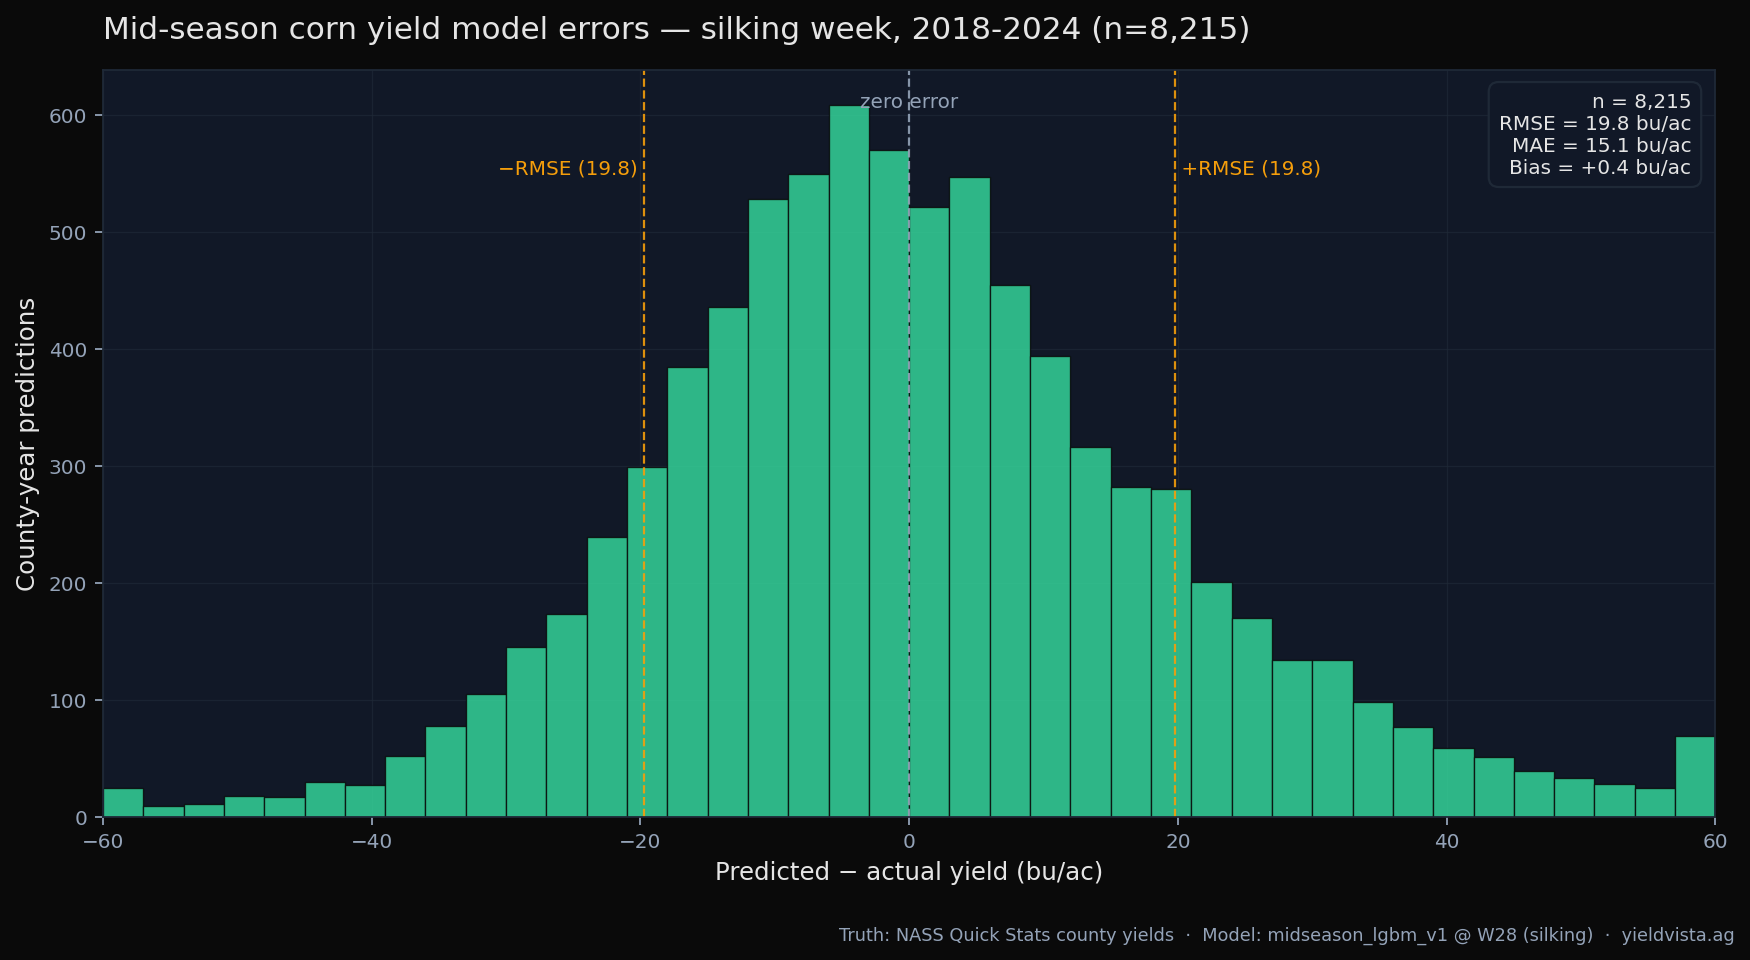
What RMSE and MAE actually say
Two error magnitudes matter:
- MAE (mean absolute error) is the typical miss. If MAE is 11 bu/ac, half of predictions are closer than that and half are further.
- RMSE (root mean square error) penalises big misses more heavily, so it’s always larger than MAE when errors aren’t uniform.
If the model predicts 200 bu/ac with MAE 11, the realised yield is usually within ±11 bu/ac. A few percent of predictions miss by considerably more — outlier county-years happen (hail, late-season drought, flooding).
Two validation lenses — and why we report both
Anyone publishing model metrics is choosing a validation lens. We report two, because they answer different questions:
Random 80/20 holdout — what production looks like
Train on a random 80% of all county-year rows, test on the held-out 20%. The model has seen every year in the training set; the held-out rows are random counties from each of those years. This is closest to what the deployed model does in real use, because production trains on every year of data available before predicting the current season.
For the 2025 corn.v1 beta yield model at silking (W30), 4-seed random 80/20 backtest:
| Phenology | R² | RMSE | MAE |
|---|---|---|---|
| W22 early veg | 0.83 | 16.6 | 12.3 |
| W26 tasseling | 0.84 | 15.9 | 11.7 |
| W30 silking | 0.86 | 15.1 | 11.2 |
| W34 grain fill | 0.86 | 14.9 | 11.0 |
| W38 dent | 0.86 | 15.2 | 11.2 |
| W42 maturity | 0.86 | 15.3 | 11.2 |
For 2025 soy.v1 beta at R3 pod fill (W34): R² 0.87, RMSE 4.3, MAE 3.1.
Year-holdout — methodology stress test
Train on years X..Y−1, test on year Y. The model has not seen year Y at all. Conservative. Answers “if the pipeline weren’t cheating with leaked features or spatial autocorrelation, does the methodology actually generalize to an unseen growing season?”
We run this every season as an internal stress test — it’s how we proved the methodology generalizes after the 2026-05-06 target-leak fix. The production-config numbers above are the deployment skill; the year-holdout is the floor that the production model improves on as it sees one more season of data.
Directional ≠ point forecast
The model is built around directional intelligence: is this county or field above or below trend, by what magnitude, with how much confidence. A 4% lift over trend is a real read even when the absolute point estimate carries an RMSE of 15 bu/ac. The read is in the relative comparison, not the integer.
When to trust a read
The model is most informative once the crop has accumulated growing degree days through the critical reproductive window: silking for corn (roughly W30), pod-fill for soy (roughly W34). Earlier in the season, predictions move week-to-week as new weather and NDVI data come in. Late-season (W38+) predictions are essentially a confirmation read.
The validation numbers above are refreshed each season. See how we measure crops for the methodology and data sources.